Din varukorg är tom, men det behöver den inte vara.
-
+
Glamos Walker APP
0 EUR
Walk App allows the user to graphically and tabularly display all measured data, and accurately analyze the quality of the network. Compatible with Sensor-Onli
Dela
Artikelnummer:
158
Information
Visualization
Walk App allows the user to graphically and tabularly display all measured data, and accurately analyze the quality of the network. This includes positioning of gateways and measuring point based on GPS coordinates, graphical display of signal strength, filtering by various parameters.
Integration
You can integrate all LoRaWAN testing devices into Walk App and have it’s data on one place. You just need to enable the integration of data from the LoRaWAN server to the Walk App with HTTP POST integration. You can make integration from The Things Network, Loriot, Actility and other servers.We recommendGlamos Walker because it is most advanced LoRaWAN testing device on market.
You haveAdeunis FieldTest deviceor GPS tracker orcustom made device?No problem, we will help you to integrate it in Walk App. It will enable you to store dataand improve analyticsof your LoRaWAN network.
Store and analyze
All data is also available through table where the user can also filter it, download it and generate reports as well. After field testing you can accurately analyze the quality of the network. Filter data based on SF, time, gateway and device.
Use cases
Analyze location for optimization of setting up sensor devices
Analyze location where gateway is set up to estimate how efficient is it
Analyze indoor measurements – make plan of building with measuring points and connect that point with “counter” of message
Find blind spots in network
Visualize network coverage
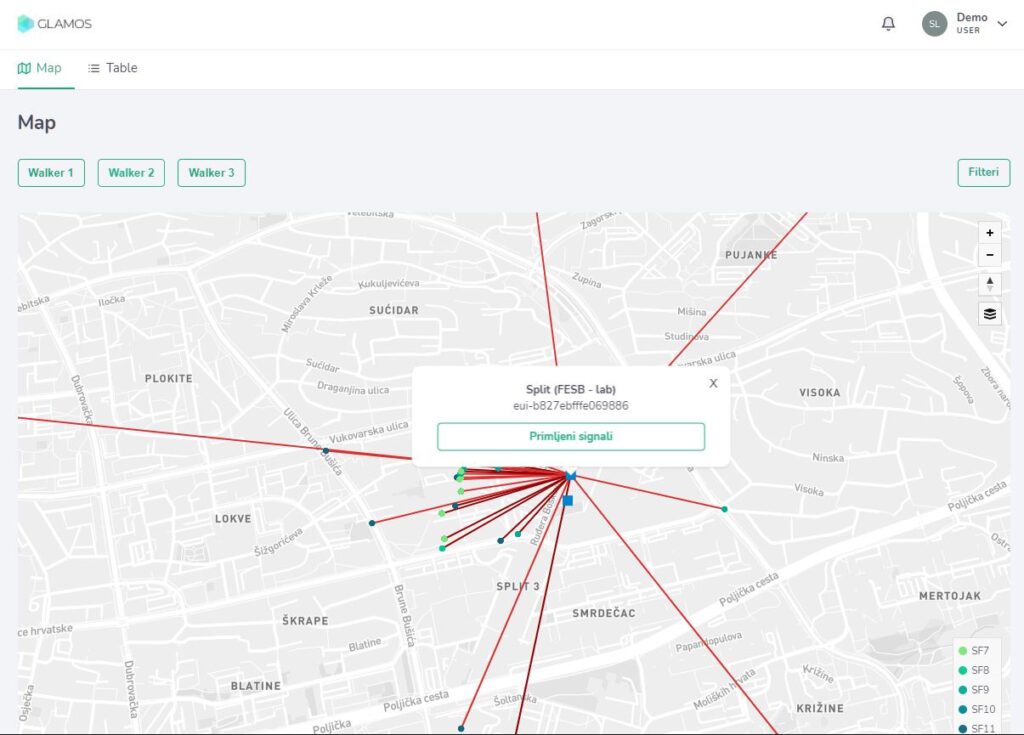
) Walk App consists of map where are displayed all gateways (blue rectangles) and measuring points (small circles). Measuring point is place where from you are sending message through LoRaWAN network.
) You can filter data on map by device, SF, server and time of testing
) If you click on some measuring point you will get more information. It consists frequency, SF, bandwidth, coding rate, GPS coordinates, time of sending and names of all gateways which received message. These gateway’s names are paired with RSSI, SNR and distance between gateway and measuring point. Also it will show red lines which connects measuring point and gateway.
) If you click on some gateway it will show all measuring points which sent message to gateway. They will be connected with lines also so you get visual prediction of network. This can be used to see how good is position of gateway and is there some position that is not covered.
) Map has different views.
3D buildings layer enable fully visualization of area where you are testing. On this way you can see how buildings affect communication.
Satellite layer will show you photo of area.
Outdoor layer will give you visual of elevation in nature.
Light layer will show you streets and roads.
3D buildingsSatelliteOutdoorLight
) Table will show you all stored data. That includes data without GPS coordinates. If you do indoor testing, you can use time and counter to visualize coverage indoor. On display of Walker you can see counter and write it down and later compare it to data in table. All data includes time, counter, frequency, SF, BW, CR, GPS coordinates. If you click on a row (represent measuring point) it will show all gateways together with RSSI and SNR. You can filter data based on SF, gateway name, device(s) and time.


